Business Analytics Platforms: Guide to Data Analysis and Decision Support
Business Analytics Platforms are software environments that help organizations collect, organize, analyze, visualize, and interpret business data. They bring information from sources such as financial systems, customer databases, websites, operational applications, spreadsheets, and enterprise software into analytical workflows.
Instead of examining large amounts of raw information manually, users can use dashboards, reports, data models, statistical methods, and visualization tools to identify patterns and monitor business activity.
A typical platform may combine data integration, reporting, business intelligence, predictive analytics, artificial intelligence, visualization, and collaboration features. The exact capabilities vary between platforms and deployment models.
How Business Analytics Platforms Work
The analytical process generally involves several stages:
Data collection: Information is gathered from business applications, databases, files, websites, devices, and other sources.
Data integration: Information from different systems is connected and organized.
Data preparation: Inconsistent, duplicated, incomplete, or incorrectly formatted information is processed.
Data modeling: Relationships between datasets are established so users can analyze information consistently.
Analysis: Users apply calculations, filters, statistical techniques, or analytical models.
Visualization: Results are displayed through charts, tables, dashboards, and reports.
Decision support: Business users interpret the results and use them as one input into planning and operational decisions.
The quality of the final analysis depends heavily on the quality, completeness, consistency, and relevance of the underlying data.
Major Types of Analytics
Business analytics generally includes several approaches.
Descriptive analytics examines what has already happened. For example, a company might analyze quarterly revenue by region.
Diagnostic analytics investigates why a particular result occurred. A decline in website conversions, for example, could be examined across traffic sources, product categories, and customer segments.
Predictive analytics uses historical and current information to estimate possible future patterns. Examples include demand forecasting and equipment failure analysis.
Prescriptive analytics examines possible actions under defined conditions. It can compare scenarios and identify potential consequences, while the final decision remains with people responsible for the relevant business activity.
Importance
Turning Data Into Understandable Information
Organizations often have information distributed across many systems. Business Analytics Platforms can bring selected datasets into common analytical environments where users can examine relationships and trends.
A financial manager, for example, may combine revenue, expenses, inventory, and regional information into one dashboard instead of reviewing separate spreadsheets.
Supporting Faster Analysis
Automated data refreshes, reusable reports, and dashboard components can reduce repetitive analytical work. Users can apply filters or change reporting periods without rebuilding every calculation manually.
The actual time savings depend on the quality of the data architecture and the complexity of the analytical workflow.
Monitoring Business Performance
Dashboards can display indicators such as revenue, inventory levels, production volumes, website activity, customer transactions, or operational performance.
Organizations can establish different dashboards for different teams. Executives may need high-level indicators, while analysts and operational teams may require more detailed information.
Identifying Patterns and Relationships
Analytics platforms can reveal relationships that may be difficult to identify through isolated records. For example, a retailer could compare purchasing patterns across regions, seasons, product categories, and customer groups.
These findings can contribute to planning, although analytical relationships should not automatically be interpreted as proof that one factor caused another.
Supporting Multiple Business Functions
Business Analytics Platforms can be used across areas such as:
Finance and accounting
Marketing
Sales analysis
Supply chain management
Manufacturing
Human resources
Customer operations
Information technology
Risk management
Energy management
Healthcare administration
Transportation and logistics
Common Platform Capabilities
| Capability | Main Purpose | Example |
|---|---|---|
| Data integration | Connect information sources | Combining databases |
| Dashboards | Display key measurements | Executive performance view |
| Reporting | Produce structured reports | Monthly financial report |
| Data modeling | Organize relationships | Connecting sales and product data |
| Visualization | Present analytical results | Charts and interactive graphs |
| Forecasting | Estimate future patterns | Demand planning |
| AI analytics | Analyze complex datasets | Pattern detection |
| Collaboration | Share analytical outputs | Team dashboards |
Recent Updates
Generative AI in Analytics
Generative artificial intelligence is becoming increasingly integrated into analytics platforms. Natural-language interfaces can allow users to ask questions about datasets using conversational language rather than constructing every query manually.
For example, a user could ask which product categories experienced the largest change during a selected period. Depending on the platform, the system may generate a query, create a visualization, or summarize the result.
AI-generated analysis still requires validation because incorrect data interpretation, incomplete context, or unsuitable assumptions can produce misleading results.
Automated Data Preparation
Data preparation remains an important part of analytics, and modern platforms increasingly automate portions of this process.
Functions can include identifying duplicate records, detecting unusual values, suggesting relationships between datasets, and helping users transform information into consistent formats.
Automation can reduce repetitive work, but organizations still need data governance rules and human oversight.
Cloud-Based Analytics
Cloud computing has changed how analytical platforms are deployed. Organizations can use cloud infrastructure to store and process large datasets without maintaining all analytical computing resources within their own facilities.
Cloud-based analytics can also support distributed teams and connections between multiple business applications. Data residency, security, regulatory requirements, and organizational architecture remain important considerations.
Real-Time and Near-Real-Time Analytics
Traditional reporting often relies on scheduled data updates. Modern platforms increasingly support real-time or near-real-time analytical workflows.
This can be useful for applications such as transaction monitoring, logistics tracking, industrial operations, website activity, and operational dashboards where information changes frequently.
Not every business process requires real-time analysis. The appropriate update frequency depends on the decision being supported and the characteristics of the underlying data.
Embedded Analytics
Embedded analytics places charts, reports, and analytical functions directly inside business applications.
For example, an inventory application may include demand trends within the same interface used to manage stock. This reduces the need to move between separate applications when examining related information.
Increased Data Governance
As analytics becomes more closely connected with AI and automated decision systems, organizations are placing greater attention on data quality, access controls, lineage, privacy, security, and responsible use.
Governance helps establish where data came from, who can access it, how it can be used, and how analytical outputs should be managed.
Laws or Policies
Data Protection Requirements
Business Analytics Platforms can process personal, financial, employee, customer, and operational information. Consequently, organizations need to consider data protection requirements in the jurisdictions where information is collected or processed.
The European Union's General Data Protection Regulation (GDPR) establishes requirements concerning the processing of personal data and applies in specified circumstances involving organizations and individuals connected with the European Economic Area.
Other jurisdictions have their own privacy frameworks, including the California Consumer Privacy Act and related California privacy legislation in the United States.
Data Security
Analytics environments can contain sensitive information, making access management and security controls important. Organizations commonly use identity management, authentication, authorization, encryption, logging, monitoring, and other protective measures.
International standards such as ISO/IEC 27001 provide frameworks for information security management. The specific controls required depend on the organization, data, technology environment, and applicable regulations.
Artificial Intelligence Governance
AI-enabled analytics introduces additional considerations around transparency, accountability, human oversight, data quality, and risk management.
The European Union's AI Act establishes a risk-based regulatory framework for artificial intelligence, with different obligations depending on the type and use of an AI system.
Organizations operating internationally may therefore need to evaluate both data protection and AI-related requirements when deploying advanced analytics capabilities.
Financial and Industry Requirements
Some industries have additional requirements concerning data retention, reporting, privacy, security, and auditability.
Financial institutions, healthcare organizations, public-sector bodies, and companies operating critical infrastructure may face sector-specific rules. Requirements can vary significantly by country and business activity.
Tools and Resources
Business Intelligence Dashboards
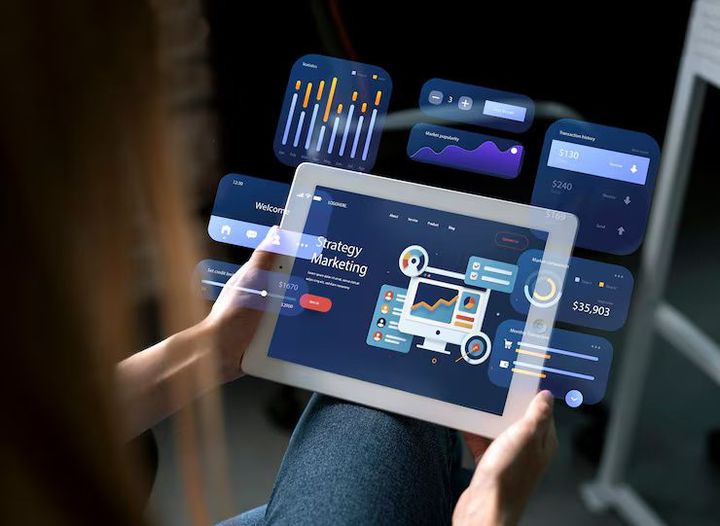
Dashboard tools allow users to display selected metrics through charts, tables, maps, and other visual elements.
A useful dashboard generally focuses on a defined analytical purpose rather than presenting every available measurement on one screen.
SQL and Data Query Tools
SQL is widely used to retrieve and analyze information stored in relational databases. Analysts can use queries to filter records, calculate values, join tables, and create datasets for further analysis.
Statistical Analysis
Statistical tools can support correlation analysis, forecasting, regression, segmentation, sampling, and other analytical methods.
Statistical methods should be selected according to the research question and characteristics of the available data.
Data Visualization
Charts and interactive visualizations can make complex datasets easier to examine. Common formats include:
Bar charts for category comparisons
Line charts for changes over time
Scatter plots for relationships between variables
Maps for geographic patterns
Tables for detailed values
KPI cards for selected measurements
The visualization should match the type of information being examined.
Data Catalogs and Governance Tools
Data catalogs can document datasets, definitions, ownership, lineage, and access information. Governance tools can help organizations establish consistent terminology and data-management policies.
Forecasting and Machine Learning Tools
Advanced analytics environments may include forecasting, classification, clustering, anomaly detection, and machine-learning capabilities.
These methods can identify patterns in large datasets, but their outputs should be evaluated against data quality, model assumptions, validation results, and the intended business context.
FAQs
What are Business Analytics Platforms?
Business Analytics Platforms are software environments used to collect, organize, analyze, visualize, and interpret business information for reporting and decision support.
How do Business Analytics Platforms help organizations?
They can connect information from different sources, create dashboards and reports, identify patterns, support forecasting, and make analytical information easier to examine.
What is the difference between business intelligence and business analytics?
Business intelligence commonly focuses on reporting, dashboards, and understanding historical or current performance. Business analytics can include these functions while also incorporating statistical analysis, forecasting, predictive modeling, and other advanced analytical methods.
Can Business Analytics Platforms use artificial intelligence?
Yes. Many modern platforms incorporate AI for functions such as natural-language queries, automated insights, forecasting, anomaly detection, data preparation, and analytical assistance. The specific capabilities differ between platforms.
Are Business Analytics Platforms useful for small organizations?
They can be useful for organizations of different sizes. The appropriate analytical environment depends on data volume, reporting requirements, technical capabilities, security needs, budget constraints, and the complexity of the decisions being supported.
Conclusion
Business Analytics Platforms provide environments for connecting business information, analyzing datasets, creating visualizations, and supporting data-informed decisions. Modern platforms increasingly combine dashboards and traditional reporting with cloud computing, automation, artificial intelligence, real-time analysis, and embedded analytics. Data quality, security, privacy, governance, and appropriate interpretation remain important regardless of the technology used. As analytical systems become more capable, organizations must consider both technical functionality and the regulatory environment surrounding their data.